The average Croydon home sold for £396,760 in May 2026 (Land Registry). Prices by type, the priciest corners, and how the borough compares to London.
Whether you are buying your first flat in West Croydon, trading up to a semi in Shirley or wondering what your Coulsdon house is now worth, the same problem comes up: every website quotes a different “average Croydon price”. The figure that actually matters is what homes genuinely change hands for, recorded by HM Land Registry once every sale completes. This is a plain read of those numbers for 2026: the borough average, which way it is moving, what each property type costs, where the expensive corners are, and how Croydon sits against London and England.
The headline figure for 2026
The average home in the borough of Croydon sold for £396,760 in May 2026. That is the provisional figure from the official UK House Price Index, which is built from completed Land Registry sales rather than asking prices.
Over the year to May 2026 prices were essentially flat, down just 0.4%. That is a much softer landing than London as a whole, where average prices fell 3.7% over the same year. Croydon’s relative affordability is doing the work here: with the capital’s average at £545,000, a borough where the typical home costs £150,000 less keeps pulling in buyers who have been priced out closer in, and that steady demand has held values roughly where they were.
One thing to watch when you compare sources. Portals quote different geographies: Rightmove’s Croydon page shows about £421,000 for the past year, and Plumplot’s figures for the CR postcode area average £463,000, but that postcode area stretches beyond the borough and includes Caterham in Surrey, where one sector averages £1.5 million. Always check whether a “Croydon” figure means the borough, the postcode area or just the town before you rely on it.
What it means for you
If you are selling, a flat market means realistic pricing from day one; buyers have plenty of choice and little fear of missing out. If you are buying, you have negotiating room that did not exist in 2021 and 2022, especially on flats, which are the one segment genuinely falling in price. It is worth checking the council tax band of any home you view, since Croydon’s rates are among the highest in London and the yearly bill is a real running cost. If you are staying put, your home has held its value in cash terms over the past year while London as a whole slipped.
Prices by property type
The borough average hides a wide spread. These are the Croydon averages for May 2026 from the UK House Price Index:
- Detached houses: around £847,000, down 0.8% on the year. Concentrated in Purley, Sanderstead, Selsdon and Shirley.
- Semi-detached houses: around £544,000, up 1.2%. The classic family move in the borough’s suburbs.
- Terraced houses: around £404,000, up 1.6%, the strongest performer of the year. Sitting almost exactly on the borough average.
- Flats and maisonettes: around £259,000, down 2.8%. The most affordable way in, and the segment where buyers hold the most cards.
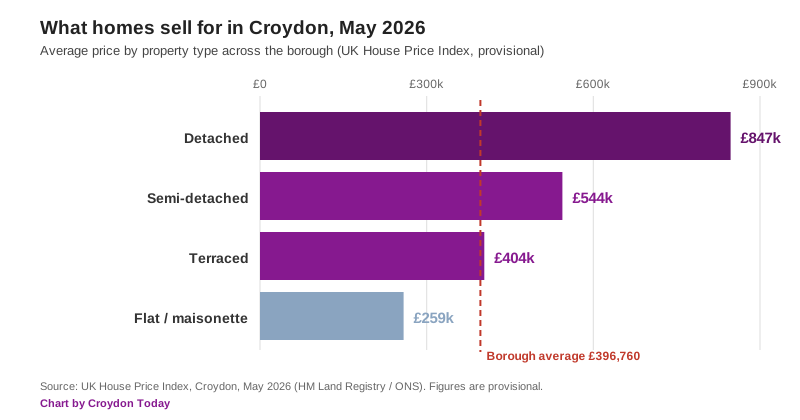
The pattern is the same one showing across the South East: houses are holding or edging up, flats are softening. Flat buyers are the most exposed to mortgage rates and service-charge inflation, and in a borough with as much new-build flat stock as central Croydon, supply is plentiful.
First-time buyers and home movers
The same dataset splits buyers usefully. A first-time buyer in Croydon paid an average of £332,659 in May 2026, down 0.6% on the year. A home mover paid an average of £505,706, essentially unchanged. The £173,000 gap between those figures is, in practice, the size of the step from a first flat to a family house here.
The priciest corners, and the most affordable
The top of the Croydon market lives in the south of the borough. Purley, Sanderstead and the private roads around them carry the borough’s biggest price tags, with the Webb Estate in Purley long established as the most expensive enclave. Nearer the centre, sold-price research compiled from Land Registry data by Property Solvers puts streets such as Grimwade Avenue and Upfield in the Shirley Park area (around £1.1m to £1.4m) and Whitgift Avenue in South Croydon (around £1m) at the top of the CR0 and CR2 postcodes (London Now).
At the other end, Plumplot’s postcode-sector data puts the most affordable pocket of the postcode area in CR0 9, covering part of west Croydon towards Beddington, at around £327,000. The broad rule holds across the borough: prices climb as you head south and east into the hills, and ease along the A23 corridor and around the town centre, where flats dominate the stock.
How Croydon compares to London and England
| Area | Average price (May 2026) | Change over the year |
|---|---|---|
| Borough of Croydon | £396,760 | -0.4% |
| London | £544,814 | -3.7% |
| England | £292,095 | +2.3% |
All three figures come from the UK House Price Index for May 2026. In plain terms, the average Croydon home costs nearly £150,000 less than the average London home but about £105,000 more than the England average. That gap to the rest of the capital, combined with trains that reach London Bridge in 14 minutes, is the borough’s core offer, and it is why Croydon’s market held flat through a year in which inner London fell.
Frequently asked questions
What is the average house price in Croydon?
The average home in the borough of Croydon sold for £396,760 in May 2026, according to the provisional UK House Price Index built from HM Land Registry sales. That covers all property types across the whole borough, from Norbury to Coulsdon.
Are Croydon house prices going up or down in 2026?
They are broadly flat: down just 0.4% in the year to May 2026, against a 3.7% fall for London as a whole. Terraced and semi-detached houses edged up over the year; flats fell by about 2.8%.
How much does a house cost in Croydon compared to a flat?
In May 2026 the average terraced house cost about £404,000 and the average semi about £544,000, while the average flat cost about £259,000. Detached homes, mostly in the south of the borough, averaged around £847,000.
Where are the most expensive homes in Croydon?
In the south of the borough: Purley, Sanderstead and the private roads of the Webb Estate carry the top prices, while Land Registry research puts Grimwade Avenue and Upfield near Shirley Park at the top of the central postcodes, with averages above £1 million.
Is Croydon cheap for London?
Yes, relatively. The borough average of £396,760 is nearly £150,000 below the London average of £544,814, which is precisely why demand has stayed firm while pricier boroughs have fallen.
Where can I check what a specific house sold for?
Every completed sale in England and Wales is public. Look up any street or address free on the HM Land Registry Price Paid service, or browse the same data on Rightmove and Zoopla.
Sources
- UK House Price Index, Croydon (ONS / HM Land Registry) for the borough average, property-type and buyer-type figures.
- UK House Price Index open data (HM Land Registry) for the London and England May 2026 comparisons.
- Plumplot Croydon house prices (CR postcode area, from Land Registry data) for postcode-sector context.
- Rightmove Croydon house prices for portal-average context.
- London Now: Croydon’s most expensive streets (Property Solvers research from HM Land Registry sold prices).
- HM Land Registry Price Paid search to check any individual address.
Figures are provisional and revised as more sales complete. Always confirm the latest numbers against the linked HM Land Registry and ONS sources before making a decision. Our other guides cover Croydon council tax bands, trains to London and Croydon planning news.
Have your say
We read every message. To comment on this story, email the newsdesk and we may publish a selection of responses: hello@croydontoday.co.uk.