Croydon's claimant count reached 16,835 in July, 6.2% of working-age residents. Under-25s are the only age group above last year. Every ward ranked.
16,835 people in Croydon were claiming unemployment-related benefits in July 2026, equal to 6.2% of residents aged 16 to 64, according to figures published through nomis on 18 August.
The count is 225 higher than in June and 500 lower than in July 2025. Underneath that, one group is moving the other way from everyone else.
Under-25s are the only age band up on the year
Croydon’s claimant count by age, comparing July 2026 with a year earlier:
- 16 to 24: 2,895, up 90 on July 2025
- 25 to 49: 9,850, down 435
- 50 and over: 4,090, down 155
The under-25 group also accounts for more than half of the month’s rise. It went up by 130 between June and July, against 70 for the 25 to 49 band and 25 for the over-50s.
That is worth watching rather than reacting to. These figures are not seasonally adjusted at borough level, and July is the month school and college leavers start appearing in the count, so a single month proves nothing on its own. The year-on-year direction is the harder number: every other age group in Croydon has fallen since last summer, and this one has not.
The gap between wards is more than three to one
The borough figure of 6.2% covers wards that look nothing like each other.
- Highest: Thornton Heath 8.8%, Selhurst 8.5%, New Addington North 8.4%, West Thornton 8.3%, Broad Green 8.2%
- Lowest: Sanderstead 2.7%, Kenley 3.2%, Old Coulsdon 3.2%, Park Hill and Whitgift 3.4%, Coulsdon Town 3.6%
By headcount rather than rate, the largest numbers are in Broad Green (1,235), Fairfield (1,165), Thornton Heath (1,120) and West Thornton (1,115). Together those four wards hold 4,635 claimants, more than a quarter of the borough total, from four of its 28 wards.
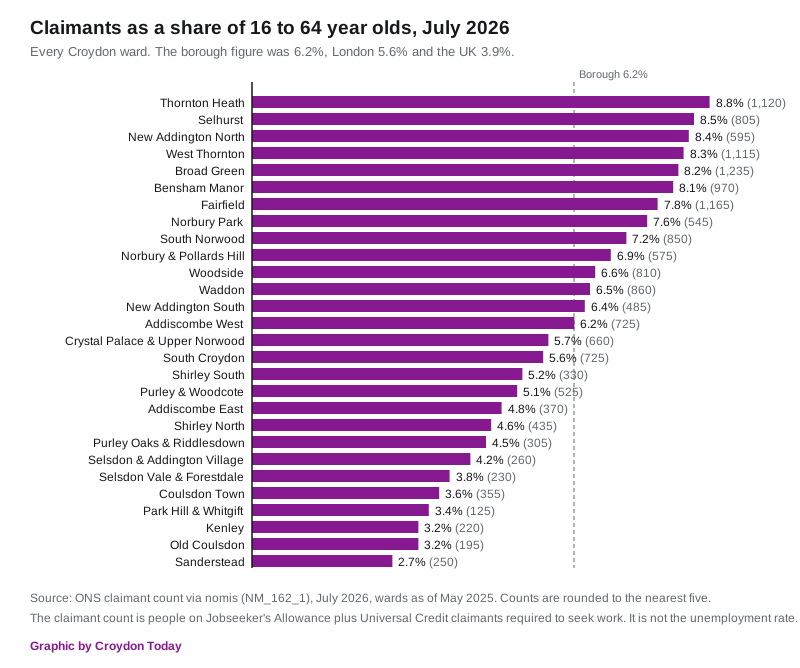
Ward figures are only published for the current boundaries, with no back series, so there is no ward-level comparison with last year to be made yet.
How Croydon sits in London
At 6.2%, Croydon has the joint eleventh highest claimant rate of London’s 33 boroughs, level with Lambeth. The highest are Barking and Dagenham, Haringey and Newham, all at 7.5%. The lowest, leaving aside the City of London, are Richmond upon Thames at 2.6% and Kingston upon Thames at 3.2%.
By raw numbers Croydon is fifth in London, behind Newham (20,385), Brent (17,570), Ealing (17,325) and Tower Hamlets (17,260). Croydon has the largest population of any London borough, an ONS mid-2024 estimate of 409,342, which is why it ranks higher on headcount than on rate.
On the same nomis series, London stood at 5.6% in July and the United Kingdom at 3.9%.
Two things this number is not
It is not the unemployment rate. The claimant count is the number of people on Jobseeker’s Allowance plus Universal Credit claimants who are required to look for work and be available for it (nomis source notes). It misses unemployed people who do not claim, and it includes some people who are working but on low enough earnings to still face work-search conditions.
It is not the figure in the national headlines. The ONS labour market bulletin published on 18 August put the UK claimant count at an estimated 1.665 million and said it fell on the month and on the year. That is a separate, seasonally adjusted national estimate, and it does not line up with the nomis series used for local areas. Every comparison in this article is drawn from the nomis series alone, so that like is set against like.
For national context, the same ONS bulletin put the UK unemployment rate at 4.9% for April to June 2026, with 707,000 vacancies in May to July.
What it means for you
If you are 16 to 24 and looking for work, Croydon Council’s Post-16 Participation Team advises on training, apprenticeships and next steps on 020 8726 7485 or at Post16@croydon.gov.uk. Croydon Works, a free recruitment service run with Jobcentre Plus, Croydon College and the council, has a walk-in office at the Croydon Clocktower on Katharine Street, open 9am to 5pm on weekdays.
If you are claiming and worried about a sanction or a payment, the council’s welfare and benefits advice pages list the local support routes, and Citizens Advice Croydon gives free independent help. Council tax support is applied for separately from Universal Credit, and it is the bill most often missed: our Croydon council tax bands page sets out what each band costs before any reduction.
If you are reading this as a landlord, employer or councillor, the ward chart above is the practical part. The borough average of 6.2% is not a description of anywhere in particular: it is the midpoint between Thornton Heath at 8.8% and Sanderstead at 2.7%.
The next figures are due with the ONS labour market release on 15 September 2026, which will carry the August claimant count.
Sources
- ONS claimant count via nomis dataset NM_162_1, July 2026, for the borough, ward, age, London and UK figures
- nomis claimant count source notes, for the definition
- ONS mid-2024 population estimate for Croydon (409,342), as used in Defra’s ENV24 tables
- ONS, Labour market overview, UK: August 2026, released 18 August 2026
Have your say
We read every message. To comment on this story, email the newsdesk and we may publish a selection of responses: hello@croydontoday.co.uk.